Collateral
Sales decks, tools, and resources for CS and Sales teams.
Decks
Full Sales Deck v2
Complete sales presentation covering all Boostly products, value props, and case studies.
Activation Deck
Onboarding presentation for new customers covering setup and best practices.
Case Studies
All Case Studies Folder
Google Drive folder containing all case study documents and materials.
Westside Pizza Case Study (V2)
31-location corporate case study showing $85k revenue, 16k subscribers, and 550 Google reviews.
Fox's Pizza Den Case Study
Franchise case study demonstrating Boostly's impact on multi-location operations.
Domino's 90-Day Impact (V2)
90-day results analysis for Domino's franchise locations.
Marketing Packages Case Studies
Compilation of case studies for various marketing package offerings.
Wasserhund Brewing 60-Day Report
60-day SEO results showing visibility and engagement improvements, better map rankings.
Social Media Examples
Examples of social media marketing work for customers with the SM marketing package.
Process Documents
Visual Assets

Videos
Optimize Your Google Business Profile
Tutorial on optimizing Google Business Profile for restaurant success and local SEO.
Hashtags Strategy
Best practices for hashtag usage in restaurant social media marketing.
Reposts on Instagram
Guide to leveraging reposts and user-generated content on Instagram.
Pricing
- ✓Gamified Text Marketing (3k/month)
- ✓Segmentation based on lapsed customers
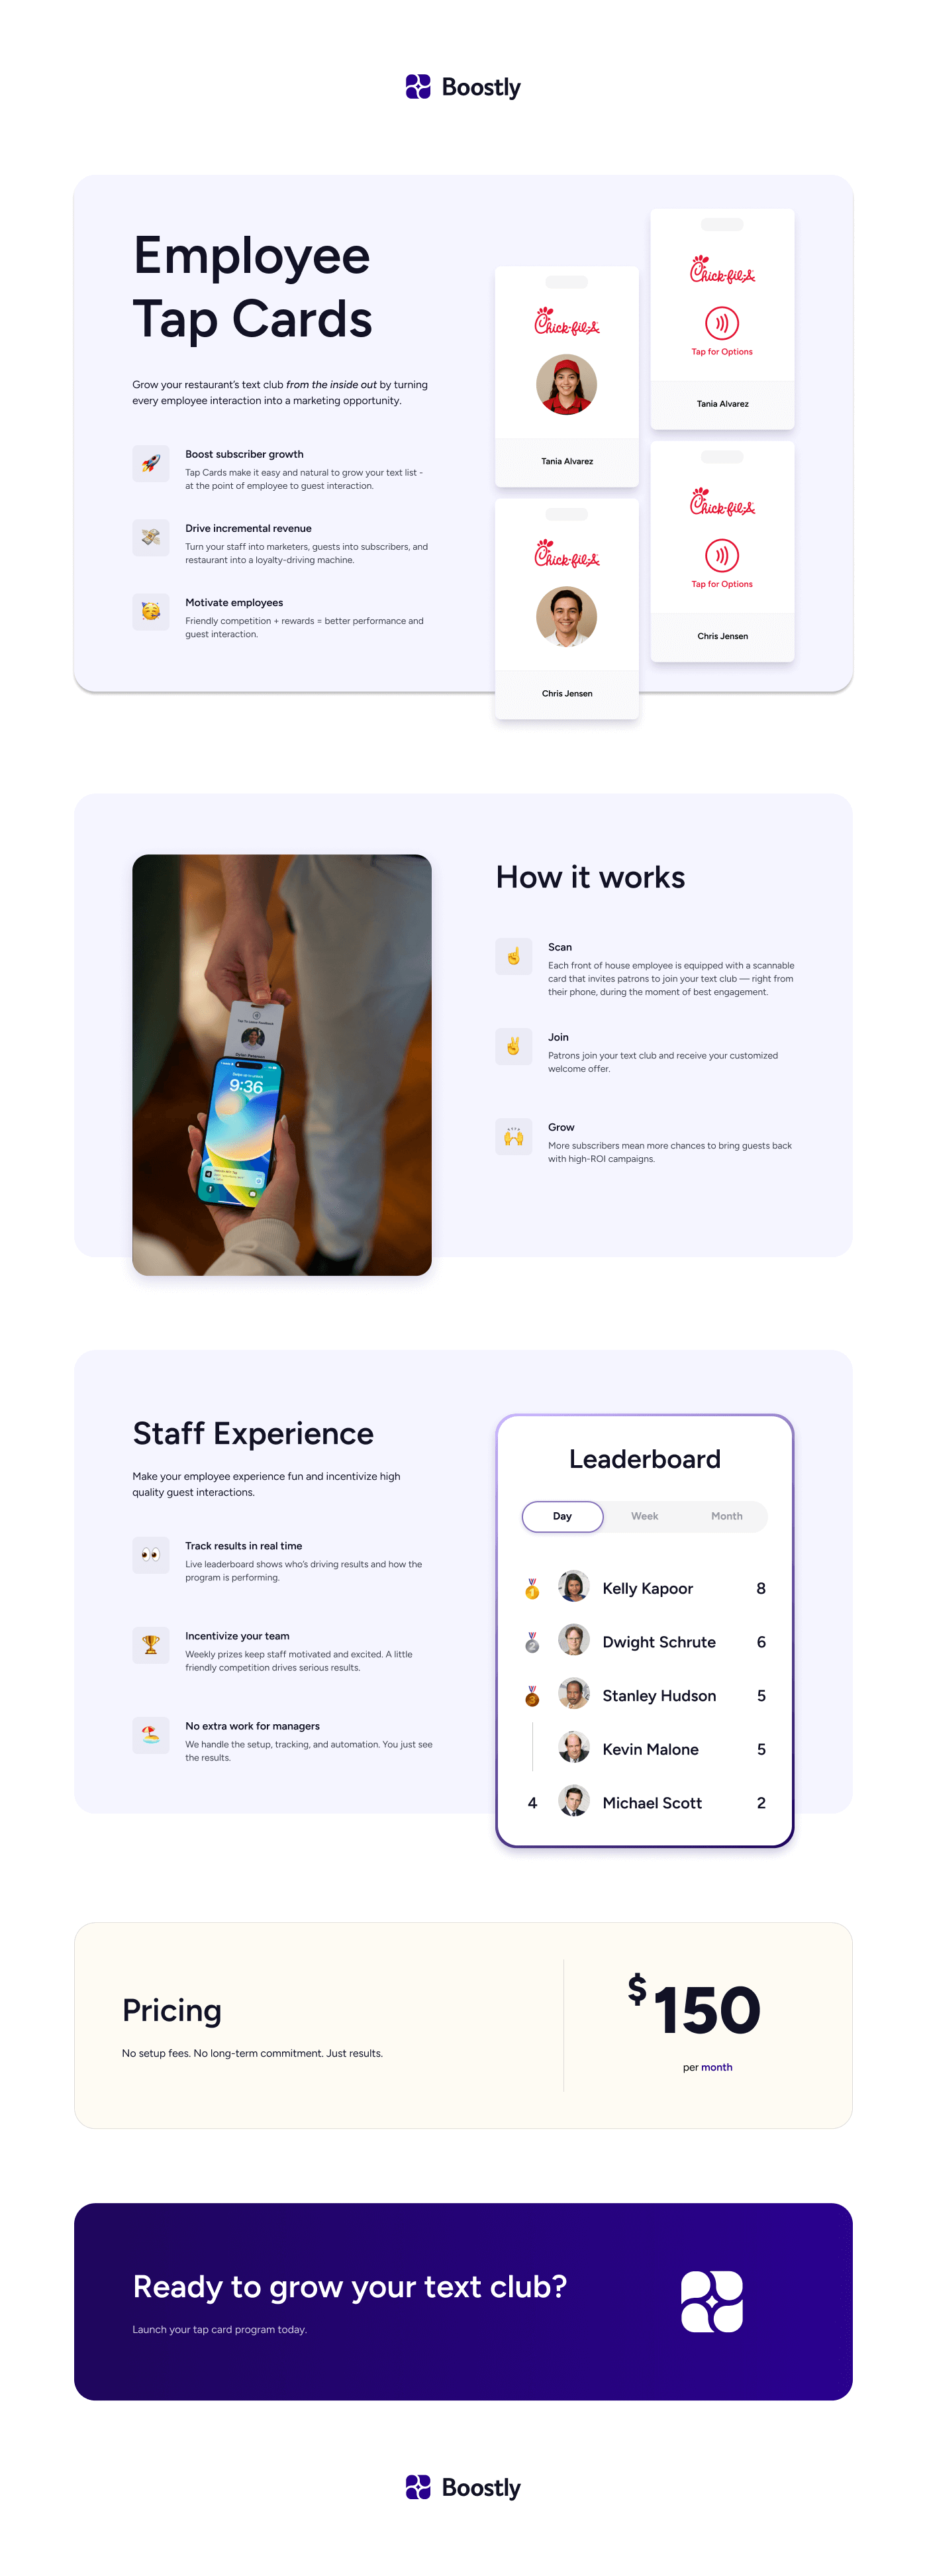
- ✓Gamified Employee Tapcards
- ✓In-Store Signage Box
- ✓AI Reputation Management
- ✓Offsite SEO Engine
- ✓Outcome Reporting
- ✓Onboarding Marketing Specialist
- Everything in Growth plus:
- ✓Gamified Text Marketing (6k/month)
- ✓Dedicated Marketing Specialist
- ✓Done for you - don't lift a finger*
- ✓Monthly campaign creation, optimization & testing
- ✓Monthly strategy report and competitor monitoring
- ✓Quarterly strategy calls & growth plans
*Includes POS & Online Ordering configuration with login access and available permissions
Pricing Details
$500 one-time setup fee per location. Covers onboarding, initial subscribe blast, text cadence setup, branding, gamification implementation, signage box, and employee tapcards.
- No overages, but if they send 15% more than their limit regularly then we reach out to either upgrade or decrease their usage
- No difference between SMS and MMS, but we are assuming internally 40% MMS
- 12 month contracts
- 6 month contracts available if approved by Nick
After two consecutive months above 15% of their text limit, the customer must decide between upgrading or reducing their usage. Their Marketing Specialst will reach out to have this conversation.
Customer must request a downgrade and Nick must approve. CSMs can use downgrades as a retention tool when customers are considering churning.
Applies to the deal.
17% off — Pay 10 months, get 12. Available when pre-paying a full 12-month contract upfront.
Applies to individual locations.
| Texts/Month | Discount Level |
|---|---|
| Up to 6,000 | Base (no discount) |
| Up to 10,000 | 6% off |
| Up to 15,000 | 21% off |
| Up to 20,000 | 27% off |
| Up to 30,000 | 35% off |
| Up to 40,000 | 38% off |
| Up to 50,000 | 40% off |
Applied to the overall account.
| Locations | Discount |
|---|---|
| 2+ | 5% |
| 5+ | 8% |
| 10+ | 10% |
Pricing Calculator
Build a custom quote for multi-location accounts
Legacy Pricing
Pricing details for all Boostly products pulled from Stripe.
Loading pricing data...
Product Info
Feature Details
Included in $300 Accelerator package or sold as $130 one-off:
- 1 point of purchase sign
- 10 table stickers for subscribing + 10 for reviews (can request more at no extra cost)
- 6 bathroom stickers for subscribing + 6 for reviews
- 1,000 to-go stickers (additional available at extra cost)
Existing active and Lurker based segmentation.
Normal reporting for now but soon to include SEO and more in-depth review data.
Automatic email report currently managed by David — no new work needed from CS/AMs.
Growth includes full service or first 90 days (Onboarding). After 90 days client is moved to tech touch. Pro includes full service full time.
Integrations
Direct integrations that automatically sync customer data with Boostly.
Slice
Pizza ordering platform integration
Toast
Restaurant POS integration
Boostly Voice
AI phone ordering integration
Menufy
Online ordering integration
Grubhub
Delivery platform integration
ChowNow
Online ordering integration
HungerRush
Restaurant technology integration
Orders2Me
Online ordering integration
POS & Ordering Systems We Pull Data From
We can import customer data from these point-of-sale and online ordering systems via CSV export.
Don't see their system? We can still work with them if their POS/OLO has a way to export customer phone numbers. Ask them to check with their provider.
Trends & Stats
Industry statistics and trends to establish authority with restaurant owners. Use these numbers in conversations with prospects.
Industry Stats
Key restaurant industry benchmarks for 2025. View full report →
Market Size & Growth
- $1.5 trillion total US foodservice sales in 2025 — NRA 2025
- $1.1 trillion traditional restaurant sales (73% of total)
- 4% nominal growth but real growth near flat (-0.2%) after inflation — Technomic
Profit Margins (Net, After All Expenses)
| Segment | Net Margin |
|---|---|
| Full-Service | 2.8-5% |
| Limited-Service/QSR | 4-6% |
| Fast Casual | 6-9% |
| Fine Dining | 6-10% |
| Ghost Kitchen | 8-15% |
Source: Toast, NRA Operations Data 2025
Cost Structure
- Food costs: 30-35% of revenue (median 32%)
- Labor costs: 25-40% of revenue (median 36.5% for full-service)
- Other costs: ~28% (rent, utilities, marketing, insurance, supplies)
- Prime cost target: 55-60% (food + labor combined)
Source: NRA Restaurant Profitability 2024
Customer Lifetime Value
| Customer Type | % of Base | Avg LTV |
|---|---|---|
| One-time visitors | 69% | $26 |
| Occasional guests | 19% | $345 |
| Regular guests | 8% | $685 |
| Loyal guests | 4% | $1,490 |
- 78.8% annual churn rate — only ~21% of last year's customers return
- 69% of guests never return after first visit
- Top 12% of customers (regular+) generate ~40% of total revenue
- Acquiring new customer costs 5-7x more than retaining existing
Source: Bloom Intelligence 2025
Industry Trends 2025
Key shifts shaping the restaurant industry. View full report →
Growth Segments vs Declining
Growing
- Fast-casual chicken: +24% sales growth (Raising Cane's +32%)
- Mexican: +11% fast-casual growth (Chipotle +14.7%)
- Korean cuisine: +10% (450 new restaurants)
- Fast casual overall: +3.2% visit growth vs +0.4% for QSR
Struggling
- Pizza: 61% of chains declining; -2.9% CAGR over 5 years
- QSR Burgers: Only +1.4% growth (below 4% inflation)
- McDonald's: +0.6% (first same-store decline since 2020)
- Arby's: -5.5% sales decline
Source: Technomic Top 500
GLP-1 Impact on Dining
- 12.4% of US adults now taking GLP-1 medications (doubled from 5.8% in Feb 2024)
- Users reduce spending at restaurants by 8.0-8.6% within 6 months — Cornell University
- 63% of users spending less on dining; visiting 50% less frequently — Morgan Stanley
- 41% ordering smaller portions; 62% drinking less alcohol
- Smoothie King launched dedicated GLP-1 Support Menu (Oct 2024); Olive Garden added "Lighter Portions"
Consumer Behavior Shifts
- "Meal deal" searches up 117%; "cheap eats" up 21% — Yelp 2025
- 40% of Americans are now "value seekers" — Deloitte
- "Solo dining" searches up 271%; solo diners spend 48% more per person ($84 avg)
- "Le Petit Chef" (immersive dining) up 509%; experiential dining demand surging
What's Working: Loyalty Programs
- Loyalty sales up 34% vs slight decline in non-loyalty sales — Bank of America
- 75% of QSR brands with loyalty reported increased traffic
- Top operators drive 37%+ of transactions via loyalty members
- Starbucks Rewards: 57% of US revenue, members spend 3x more
Source: Paytronix 2024
Technology Adoption
- 79% of operators have implemented or considering AI — Popmenu
- Online ordering grows check avg by 26% for QSR, 13% for fast casual
- Restaurant kiosks grew 43% worldwide (2021-2023); drive 10-30% higher AOV
- 30% of Gen Z use TikTok for restaurant discovery — DoorDash
Text Marketing Stats
SMS marketing benchmarks that prove the channel's effectiveness. View full report →
SMS vs Other Channels
| Metric | SMS | |
|---|---|---|
| Open Rate | 98% | ~20% |
| Response Rate | 45% | 6% |
| Click-Through Rate | 18% | 2% |
| Read Within 3 Min | 90% | — |
Sources: SimpleTexting, Peblla
Revenue Impact
- SMS marketing contributes 10-20% of monthly revenue for engaged restaurants
- 21-30% conversion rate in restaurant industry
- Dormant customer reactivation: 5-7% return rate from re-engagement SMS
- SMS recipients visit nearly 3x more frequently than non-recipients
Source: Simple Loyalty Case Study
Consumer Adoption
- 84% of consumers are opted in to receive texts from businesses
- 91% of guests express interest in signing up for text notifications
- 35% growth in SMS marketing opt-ins since 2021
Source: Incentivio
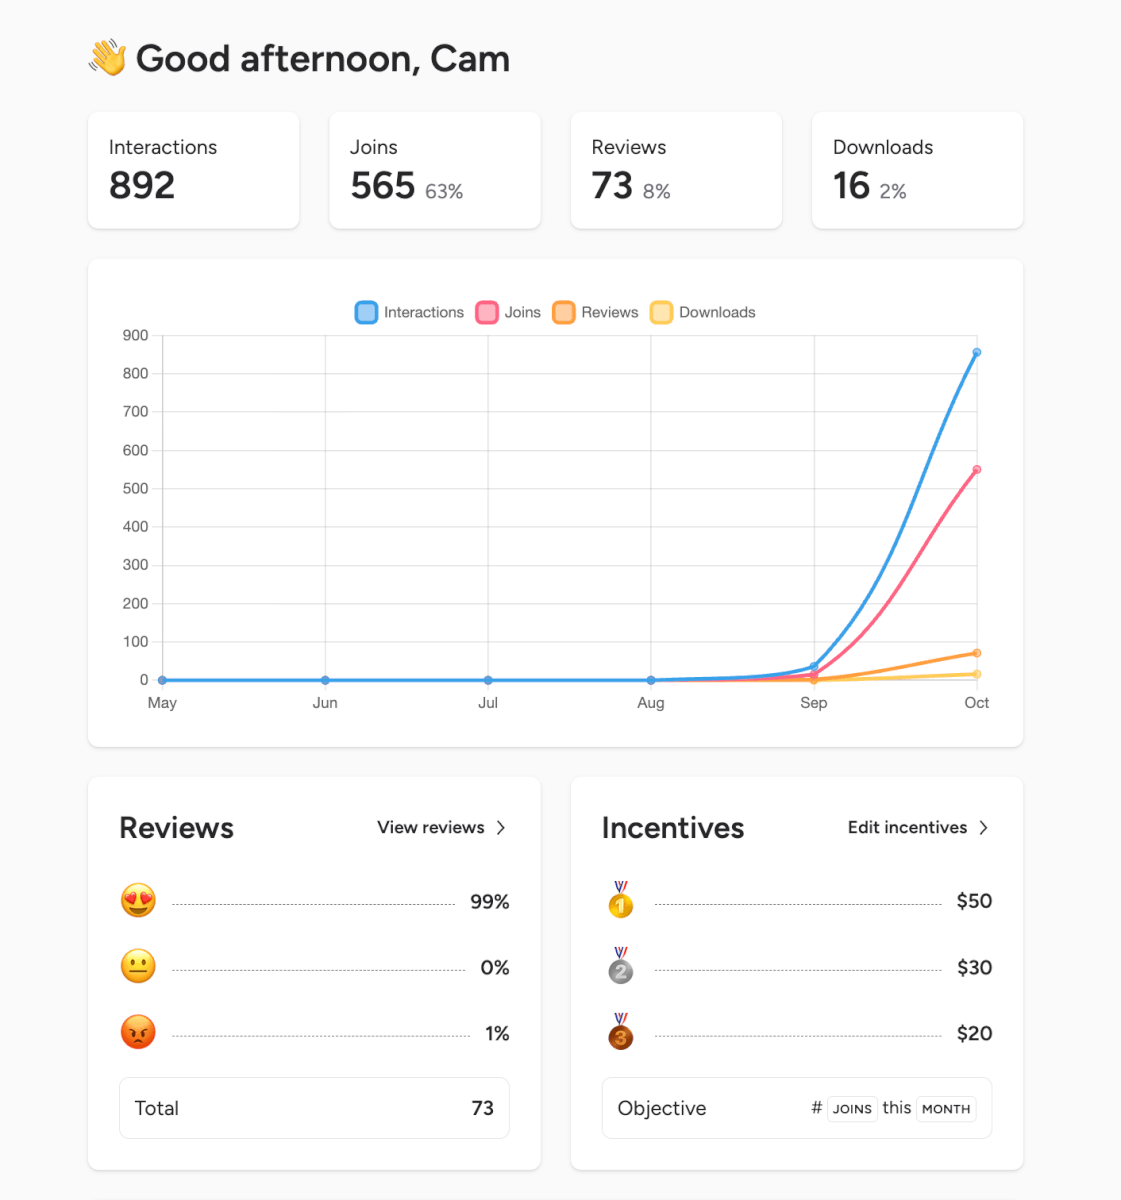
Boostly Outcomes Data
Boostly's own data on SMS subscriber value, based on 3.2M+ orders across 89 restaurant locations. View full report →
Subscriber Lifetime Value
- +59% higher LTV — $144.28 avg for subscribers vs $90.49 for non-subscribers
- 55 days sooner — Subscribers return every ~95 days vs ~150 days for non-subscribers
- +6% higher AOV — $49.58 avg order value vs $46.64
Repeat & Loyalty Rates
- +47% more repeat customers — 34.7% of subscribers order 3+ times vs 23.5%
- +83% more loyal customers — 18.5% of subscribers order 5+ times vs 10.1%
- Subscribers are 1.83x more likely to become high-frequency customers
"Punch Above Weight" Stats
- SMS subscribers are only 5.9% of customers
- But they account for 8.6% of orders and 7.6% of revenue
- That's 29% more value than their customer share would suggest
Loyalty Program Stacking (Boostly + Toast)
| Segment | Avg LTV | Lift vs Baseline |
|---|---|---|
| Both programs | $169.74 | +114% |
| Toast Loyalty only | $135.68 | +71% |
| Boostly SMS only | $115.23 | +46% |
| Neither (baseline) | $79.15 | — |
Local SEO Stats
Why local search visibility matters for restaurants. View full report →
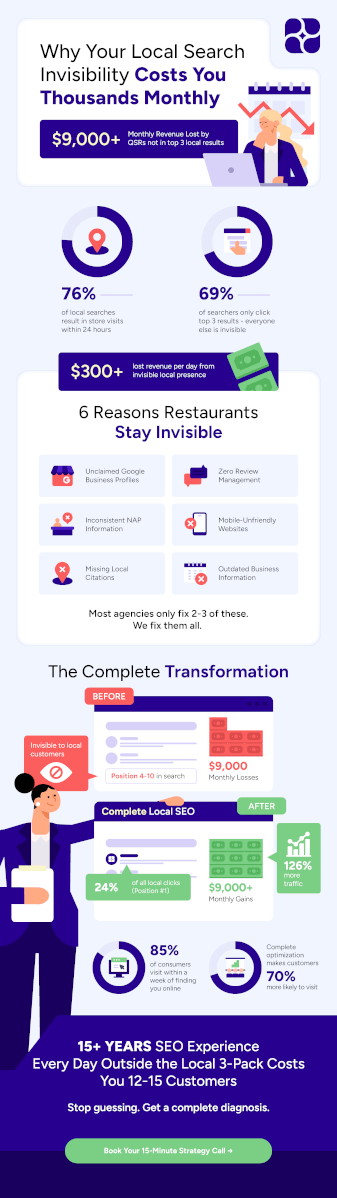
Google Maps Local Pack
- 42-44% of local searchers click on Google Maps Local Pack results (vs 29% organic, 21% ads)
- Position #1: 17.6% CTR, #2: 15.4%, #3: 15.1%
- Top 3 positions get 126% more traffic and 93% more actions than positions 4-10
Sources: SEO Design Chicago, First Page Sage
Google Business Profile Impact
- Complete profiles receive 7x more clicks — Google
- Businesses with photos get 35% more website clicks — BrightLocal
- Diners are 83% more likely to order after viewing dish photos
Revenue Connection
- Restaurant bookings from local search increased 654% YoY — Yelp 2024
- 90% of diners research restaurants online first
- SEO-optimized restaurants see up to 3.5x more visibility
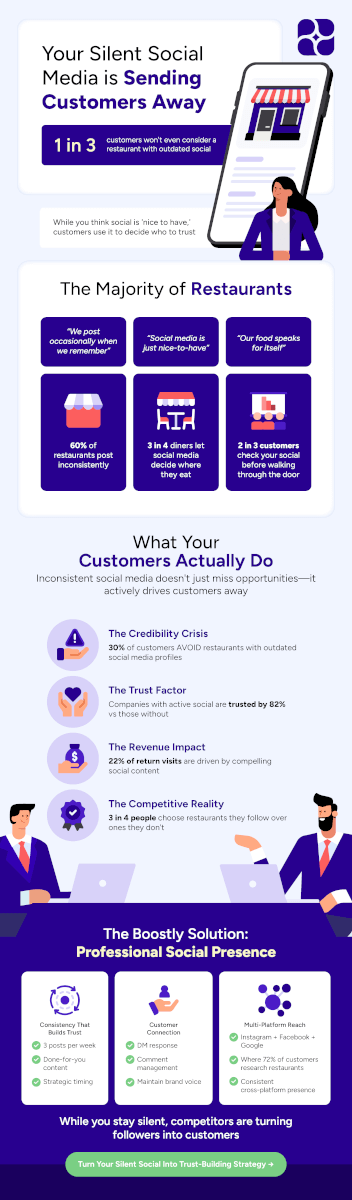
Review Stats
The revenue impact of online reviews, backed by academic research. View full report →
Revenue Impact (Harvard & Berkeley Studies)
- One-star increase = 5-9% revenue increase for independent restaurants — Harvard Business School
- Half-star improvement = 19% more likely to sell out during peak hours — UC Berkeley
- For a restaurant doing $1M/year, one star = $50,000-$90,000 additional revenue
Consumer Behavior
- 94% of diners read reviews before choosing a restaurant — BrightLocal
- 88% of Americans trust online reviews as much as personal recommendations
- 80% of customers use rating filters when searching
Reviews & SEO
- Reviews contribute 15% to Local Pack rankings — Midland Marketing
- 97% of review readers also read the business's responses — Mobal
- 88% of consumers more likely to choose businesses that reply to all reviews
- Customers spend 50% more with companies that engage with reviews — EmbedSocial
Brand Guide
Official Boostly brand assets, typography, and color palette. Click any hex code to copy it.
Logos
Horizontal
Vertical
Icon Only
Typography
Figtree is a clean yet friendly geometric sans serif font for usage in web and mobile apps. It's light-hearted and crisp when used for text, yet still retains some punch when used in uppercase — perfect for buttons and short labels. The thicker weights have a distinctly friendlier character, great for headlines of more personable brands.
Figtree comes as a variable font with 7 legacy weights, light through black, and supports 280+ Latin languages.
Color Palette
Click any swatch to copy the hex code.
Competitive Battlecards
Internal Sales Enablement — Confidential. For SDRs & AEs.
BOOSTLY vs OWNER — Sales Battle Card
Internal Sales Enablement — Confidential | For SDRs & AEs
Quick Snapshot — 30-Second Framing
Owner Definition:
Website and online ordering platform helping restaurants build branded digital storefronts, reduce third-party delivery commissions, and run basic automated marketing.
Boostly Definition:
Guest engagement and retention platform converting every customer interaction—in-store, online, third-party—into owned, marketable relationships driving repeat revenue.
Core Difference:
"Owner builds you a better front door. Boostly builds you a bigger, more loyal customer base that keeps coming back through it."
Rep Positioning Line:
"Owner is great at getting you online. We're great at making sure the customers who find you actually come back — and that you own that relationship forever."
Where Owner Is Strong
1. Branded Website & Online Ordering
Polished, conversion-optimized sites with built-in ordering; real step up from basic Wix/WordPress
2. Branded Mobile App
White-labeled app for each restaurant; premium feel; direct ordering channel
3. Month-to-Month Flexibility
No long-term contracts; lowers barrier to entry; builds trust
4. Strong Case Studies
Impressive revenue numbers ($104K+ annual, $192K in 30 days); social proof ammunition
5. 24/7 Support
Highly rated customer service; matters for late-night operators
Where Owner Is Vulnerable
1. Website-Centric Growth vs. Full-Funnel Growth
- Owner revolves around website orders (15–25% of revenue for most restaurants)
- Remaining 75–85% (dine-in, phone, catering, walk-ins) untouched
2. Overreliance on Online Ordering
- Revenue attribution tied to platform orders creates perverse incentive
- No mechanism to capture/engage/re-activate dine-in guests (highest-margin revenue)
- 5% customer fee compounds without proving value on most revenue
3. No In-Store Growth Leverage
- No table-side opt-in, receipt-based capture, or WiFi marketing integration
- Every dine-in customer walks out anonymous
- Loss of ~6,000 potential marketing contacts/month (200 covers/day scenario)
4. Shallow Text Marketing
- Templated blasts tied to ordering behavior
- No patented smart segmentation, behavioral triggers, or win-back campaigns
- Broadcast, not precision
- Untargeted messaging trains customers to ignore you; precision drives 2–5x higher redemption
5. Review Generation Is Reactive, Not Strategic
- No proactive review generation or internal feedback interception
- Boostly captures unhappy guests internally before Google reviews; funnels happy guests to public reviews
- Every 1-star increase on Google drives 5–9% more revenue
6. Data Portability & True Ownership
- Customer relationships live inside Owner's ecosystem
- Unclear if restaurants get full, segmented, opt-in-compliant contact lists upon cancellation
- Customer list you can't take isn't an asset—it's a dependency
7. No Offsite SEO Strategy
- Builds website/optimizes on-site conversions but stops there
- Missing: Google Business Profile optimization, local listing management, locally-optimized blog content, SEO-enriched review responses
- 70% of customers search online before choosing restaurants
- Optimized Google Business Profiles + local citations = up to 16% more revenue from local search
- Boostly's approach: AI-powered offsite SEO with monthly blog content, 50-minute review responses with SEO keywords
Discovery Questions
Website Dependency:
- "What percentage of your total revenue comes through your website vs. dine-in and phone orders?"
- "When someone orders through your website, what happens after that first order to bring them back?"
In-Store Conversion:
- "How are you currently capturing contact information from dine-in guests?"
- "If 100 people eat at your restaurant tonight, how many could you message tomorrow?"
Retention Gaps:
- "Do you know how many of your customers haven't come back in 30, 60, or 90 days?"
- "What's your current strategy for re-engaging a customer who ordered once but never returned?"
Review Generation:
- "How many Google reviews are you generating per week right now? Is that proactive or organic?"
- "When a guest has a bad experience, how do you find out before it becomes a 1-star review?"
Customer Ownership:
- "If you canceled Owner tomorrow, what customer data would you walk away with?"
- "Can you export a segmented, opt-in-compliant contact list from Owner right now and use it somewhere else?"
Long-Term Leverage:
- "A year from now, will your marketing platform have made your business more independent — or more dependent on it?"
- "What's your plan for turning third-party delivery customers into direct, repeat guests?"
Common Objections & Rebuttals
Objection 1: "We already use Owner."
Owner works on website/ordering side. Question is whether it covers the full picture. Most revenue from dine-in and repeat visits, not first-time online orders. Boostly fills the gap Owner doesn't touch: turning every guest into a repeat customer you reach directly.
Objection 2: "Owner handles our website and ordering."
That's 20% of your business. What about the other 80%? Dine-in guests, phone orders, catering, Google Maps finds—Boostly captures and re-engages them. Not competing with your website; monetizing what it can't see.
Objection 3: "It's all-in-one."
All-in-one = adequate at everything, exceptional at nothing. Owner bundles website, ordering, basic marketing, mobile app. Their marketing is an ordering platform add-on, not a purpose-built retention engine. Boostly built solely to turn customers into repeat, loyal guests—that's the entire product.
Objection 4: "We're getting good results."
Owner is solid. But "good results" from online ordering alone is a fraction of what's possible. Are you measuring repeat visit rate? Guest lifetime value? Dine-in conversions to marketable contacts? Boostly shows the full picture and provides tools to grow every part.
Contrast Statements
- "Owner optimizes your website. Boostly optimizes your customer base."
- "Ordering is a transaction. Ownership is leverage."
- "Owner builds your front door. Boostly makes sure people keep walking through it."
- "They grow your online orders. We grow your customer lifetime value."
- "Owner sees your customers when they order. Boostly sees them when they don't — and brings them back."
- "A website gets you found. A retention engine gets you chosen — again and again."
- "Owner's marketing is a feature. Boostly's marketing is the product."
- "They help you compete with DoorDash. We help you never need to."
- "Owner tells you how many orders you got. Boostly tells you how many customers you're keeping."
- "If you left Owner tomorrow, what would you take with you? With Boostly, the answer is everything."
Closing Frame
BOOSTLY vs TOAST — Sales Battle Card
Internal Sales Enablement — Confidential | For SDRs & AEs
Quick Snapshot
Toast Marketing:
Bolt-on marketing add-on inside a POS ecosystem sending basic email/SMS campaigns tied to transaction data.
Boostly:
Purpose-built restaurant growth platform combining SMS, review generation, offsite SEO, and retention tools.
Key Rep Line:
"Toast is great at running your POS. But their marketing tools exist to keep you inside Toast — not to maximize your revenue."
Where Toast Is Strong
1. POS-Native Data Access
Direct transaction history integration without setup
2. Single-Vendor Simplicity
One login, bill, and support number
3. Massive Install Base
Powers 120,000+ restaurants with built-in distribution
4. Bundled Pricing Leverage
Can discount marketing within broader POS package
5. Loyalty Program Integration
Points-based incentives tied directly to POS
6. Unified Reporting
Campaign results and sales data in one dashboard
Where Toast Is Vulnerable
POS Lock-In Risk
Switching POS providers means losing all marketing history, audience lists, and campaign data. Financial impact: months of lost revenue and customer data.
Surface-Level Marketing Automation
Limited to basic triggers (birthdays, win-back, promotions). No sophisticated segmentation or behavioral SMS flows. Restaurants lose 20-40% of retention revenue.
No Off-Platform SEO or Visibility
Template-based websites with limited SEO. Doesn't drive Google visibility or organic discovery (90% of diners search Google first).
No Review Generation Engine
Zero automated Google review system. Missing #1 local ranking factor and trust signal. Restaurants with 4.5+ stars and 500+ reviews see measurably higher foot traffic.
Incentive Misalignment
Toast profits from payment processing and hardware—marketing tools optimize for POS retention, not restaurant ROI.
Add-On Product Mentality
Marketing isn't Toast's core competency. Gets add-on attention vs. best engineers and fastest iteration.
Discovery Questions
- What happens to customer lists if you switch POS?
- How many new Google reviews did your marketing generate last quarter?
- Can you export your full customer contact list and use it elsewhere?
- Where do you show up on Google for your cuisine type in your area?
- What percentage of revenue comes from repeat vs. new customers?
- How do you convert third-party delivery customers into direct marketing prospects?
- What's your all-in cost across POS, processing, marketing, loyalty, ordering?
- When did Toast Marketing ship a major feature that changed your results?
- Would you be proud of your SMS open rates and redemption rates?
- Exactly how much revenue did your marketing generate last month (not just clicks)?
- Who's your dedicated marketing strategist at Toast?
Common Objections & Rebuttals
"We already use Toast Marketing."
Most users can't quantify campaign revenue. They lack review strategy, customer acquisition, and use only 20% of a real system.
"It's easier since it's inside our POS."
Easier setup ≠ effective. Boostly integrates with Toast in minutes, then adds review automation, targeted SMS with ROI tracking, and offsite SEO that Toast doesn't offer.
"We don't want another system."
Boostly runs on autopilot. Review requests, SMS campaigns, and ad management happen automatically—actually less work than manual Toast Marketing.
"It's cheaper."
Marketing is an investment, not a cost. Boostly restaurants see 600%+ ROI through measurable revenue—new customers via ads, repeat visits via SMS, discovery via reviews. Lower cost + lower results = more expensive.
"Everything is already integrated."
Integrated into Toast's ecosystem, yes. But not integrated with Google (where customers search), review profiles (where they decide), or paid channels (where you find new diners).
Contrast Statements
- "Toast helps you run your restaurant. Boostly helps you grow it."
- "POS data is transactional. An owned audience is leverage."
- "Toast marketing is a feature. Boostly marketing is a strategy."
- "If your marketing dies when you switch POS, it was never yours."
- "Toast sends messages. Boostly generates revenue."
- "You don't need more tools inside your POS. You need more customers in your restaurant."
- "Toast counts opens. Boostly counts dollars."
- "Bundled doesn't mean best. It means convenient for the vendor."
- "Toast owns the register. Boostly helps you own the customer."
- "The best restaurants don't let their POS company run their marketing."
Closing Frame
BOOSTLY vs SPOTHOPPER — Sales Battle Card
Internal Sales Enablement — Confidential | For SDRs & AEs
Quick Snapshot — 30-Second Framing
What Spothopper Really Is
Spothopper functions as an AI-powered restaurant marketing platform emphasizing website development, paid advertising, social media management, and search optimization—essentially serving as a digital storefront for restaurants needing online visibility.
What Boostly Really Is
Boostly operates as a gamified SMS marketing and retention platform converting walk-in guests into repeat customers through owned audience building that generates predictable, recurring revenue independent of ad spending.
Core Philosophical Difference
Spothopper prioritizes attracting new customers through paid channels. Boostly focuses on retaining existing customers and encouraging referrals. One rents attention; the other compounds revenue.
Rep Positioning Statement
"Spothopper helps restaurants get found. Boostly helps restaurants get repeat business. The question isn't which one is better — it's whether you want to keep paying for every new customer, or start building an audience you actually own."
Where Spothopper Is Strong
Website Design & Management
Spothopper creates polished, mobile-optimized restaurant websites with integrated menus, online ordering, and reservation systems. For restaurants lacking web presence, this delivers genuine value difficult to replicate affordably.
Paid Ads Management
They manage Google Ads and Meta Ads campaigns including creative development, audience targeting, and performance optimization. For restaurant owners with marketing inexperience and acquisition budgets, this eliminates operational friction.
Local SEO & Search Visibility
Spothopper reports 70% improvement in Google search rankings. Their AI-driven local SEO approach—Google Business Profile optimization and listing management—represents legitimate strength for discovery-phase marketing.
Enterprise & Multi-Unit Structure
With 18,000+ restaurant locations served, Spothopper offers enterprise-grade infrastructure. Multi-location groups can maintain brand consistency across units, appealing to franchise operators.
All-in-One Brand Presentation
Single dashboard integrating social media management, email marketing, review monitoring, and analytics. Appeals to operators preferring consolidated vendor relationships for upper-funnel activities.
AI-Powered Automation
Their AI marketing assistant automates campaign creation, social posting, and review responses, reducing time investment for busy restaurant operators—a significant sales conversation advantage.
Where Spothopper Is Vulnerable
Over-Reliance on Paid Acquisition
Spothopper's model requires continuous ad spending. When budgets pause, traffic stops. Restaurants experience treadmill dynamics—perpetual spending for customers never retained. No compounding growth; each month resets.
Website-First vs. Owned Audience Growth
Spothopper builds functional websites but these function as passive assets awaiting visitor arrival. No contactable customer database exists. Restaurants own URLs depending on Google's algorithmic ranking, not owned audiences.
No In-Store Activation Tools
Spothopper operates exclusively in digital channels, missing the highest-intent moment—when guests physically occupy the restaurant. No table-side opt-in mechanisms or gamified in-experience engagement exist.
Shallow Retention & SMS Strategy
Spothopper functions as acquisition-only platform, not retention-focused. Limited SMS database development. No gamified campaigns driving 10x engagement versus traditional marketing. Post-visit lifecycle—determining lifetime value—receives minimal attention.
Opaque Pricing & Contract Lock-In
Spothopper avoids publishing pricing, requiring custom quotes—signaling aggressive upselling. BBB complaints cite billing disputes and misrepresentation. Reviews document high-pressure sales tactics. Boostly counters with transparent, no-contract pricing.
ROI Transparency
Spothopper reports impressions, clicks, and website traffic—vanity metrics disconnected from actual restaurant performance. Boostly tracks redemption at registers through POS integration and multi-channel redemption tracking.
Discovery Questions to Expose Gaps
Paid Ad Dependency
"What percentage of your monthly marketing spend goes to paid ads — and what happens to your traffic if you paused that spend for 30 days?"
Retention Flywheel
"Of the customers who came in last month, how many can you reach directly right now — without paying for another ad?"
In-Store Capture
"When a first-time guest finishes their meal and walks out, what system do you have in place to bring them back?"
Review Generation
"How many Google reviews did you generate last month — and do you know which system or touchpoint actually drove them?"
Data Ownership
"If you decided to switch marketing platforms tomorrow, what customer data would you be able to take with you?"
Revenue Volatility
"How predictable is your Tuesday vs. Saturday revenue? Do you have a way to fill slow nights without running a discount or an ad?"
ROI Clarity
"When your current platform reports 'impressions' and 'clicks,' can you trace those back to actual covers in your restaurant?"
Audience Size
"How many opted-in phone numbers or email addresses does your restaurant actually own today — not your platform, you?"
Third-Party Conversion
"What's your strategy for converting DoorDash and UberEats customers into direct customers who order from you without the 30% commission?"
Lifetime Value
"Do you know the lifetime value of a repeat guest vs. a one-time visitor? And does your current platform help you increase that number?"
Guest Engagement
"When you send a marketing message right now, what's your open rate? And does it result in people actually walking through the door?"
Contract Flexibility
"Are you in a long-term contract right now? If the ROI wasn't there, could you walk away this month?"
Common Objections & Strong Rebuttals
Objection #1: "Spothopper handles our marketing already."
"That's great — and I'm not suggesting you stop. But there's a difference between marketing that gets people in the door and marketing that brings them back. Spothopper is strong at visibility. What we do is build the retention layer underneath it — so every customer they help you acquire becomes a repeat customer you can reach directly. Most of our best-performing restaurants use us alongside their existing acquisition tools, not instead of them."
Objection #2: "They manage our ads and website."
"Totally — and a good website and ads are important for being found. But here's the thing: every dollar you spend on ads rents attention for that moment. We help you build something that compounds — an owned database of real phone numbers from real customers who already love your food. That asset grows every month and costs nothing to message. Think of it this way: ads fill the funnel, Boostly makes sure the funnel doesn't leak."
Objection #3: "We're getting traffic."
"Traffic is a great start — but the question is what happens after that traffic converts. If someone comes in once and never hears from you again, the acquisition cost was wasted. We close that loop. Boostly captures those visitors at the point of experience — when they're happiest — and turns them into an audience you can bring back on demand. Traffic without retention is a leaky bucket."
Objection #4: "It's all automated."
"Automation is great — we're automated too. The difference is what's being automated. Automated social posts and ads still require continuous spend and still target strangers. Automated SMS campaigns to your owned list target people who already spent money with you — and they have a 98% open rate. Our automation compounds the value of every customer you already have. Their automation keeps buying you new ones."
Objection #5: "We don't want another vendor."
"I completely understand — vendor fatigue is real. Here's what I'd say: Boostly doesn't add work. We integrate directly with your POS and online ordering systems, we manage the campaigns, and we build the audience for you automatically. Most operators spend less than 5 minutes a week on Boostly. The real question isn't whether to add a vendor — it's whether you're comfortable leaving the most profitable part of marketing (retention) completely unaddressed."
Contrast Statements — Memorable Lines
- "Spothopper drives clicks. Boostly drives repeat customers."
- "Paid traffic rents attention. Owned audience compounds revenue."
- "Spothopper builds your digital front door. Boostly fills your dining room."
- "They help strangers find you. We help guests remember you."
- "Impressions don't pay rent. Repeat visits do."
- "When you cancel Spothopper, you lose a website. When you cancel Boostly, you keep every phone number."
- "Spothopper automates content. Boostly automates revenue."
- "A 98% open rate beats a 2% click-through rate every single time."
- "They optimize for impressions. We optimize for visits."
- "Spothopper is a marketing platform. Boostly is a revenue engine."